Memory Visualizer
Memory visualizer (a.k.a L1 visualizer), Tenstorrent Visualizer, is a comprehensive tool for visualizing and analyzing model execution, offering interactive graphs, memory plots, tensor details, buffer overviews, operation flow graphs, and multi-instance support with file or SSH-based report loading.
Installation guide
Prerequisite
You need a Linux environment.
Installation
-
Go to your virtual env in the tt-metal folder
-
pip install ttnn-visualizer
-
(optional) You should add your SSH agent, ensuring it is configured for the target folder you plan to use.
 eval $(ssh-agent)
ssh-add ~/.ssh/id_rsa -
Run $ ttnn-visualizer and go to 127.0.0.0:8000
How to Open Project
Before fetching l1 visualizer data from remote server, run your model with these environment variables.
    export TTNN_CONFIG_OVERRIDES='{
        "enable_fast_runtime_mode": false,
        "enable_logging": true,
        "enable_graph_report": false,
        "report_name": "<name of the run in the visualizer>",
        "enable_detailed_buffer_report": true,
        "enable_detailed_tensor_report": false,
        "enable_comparison_mode": false
    }'
Then, directory "/to/your/tt-metal/generated/ttnn/reports" is created. You're going to fetch this.
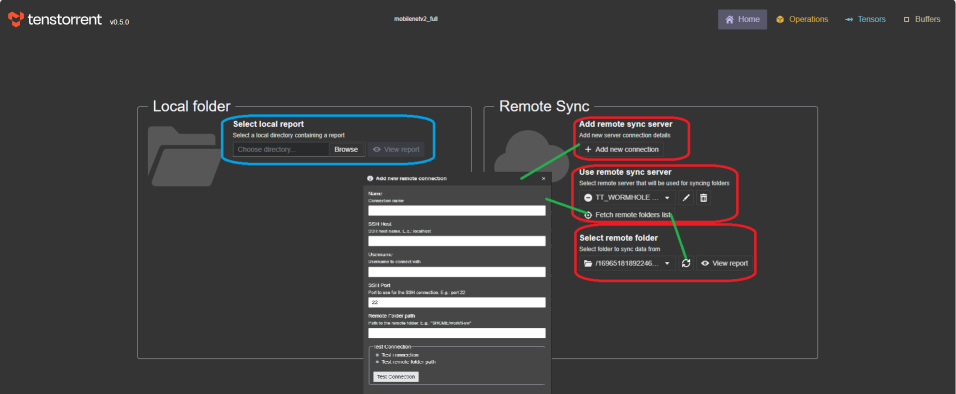
Remote Access
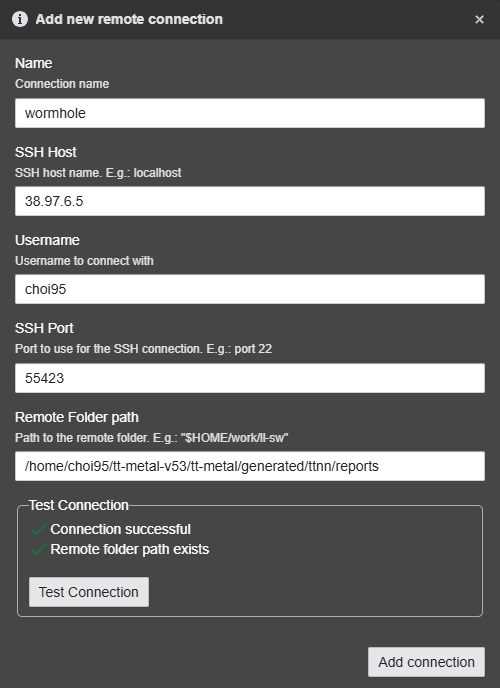
- First, click add_new_connection button.
- Fill up the pop-up.
- After establishing the connection, click fetch folder list.
- Folders are fetched, but the data aren't transferred. Click recycle button next to your folder name. That will fetch data inside the folder.
- See your reports.
- Your data is stored in ./virtual_env/lib/python3.10/site-packages/ttnn_visualizer/data/remote.
- Those reports can be shown by clicking Select local report button.
Download the report folder from remote server, and run in localhost
- $ ttnn-visualizer --profiler-path [DOWNLOADED GENERATED FOLDER]
- go to 127.0.0.0:8000 and then just use.
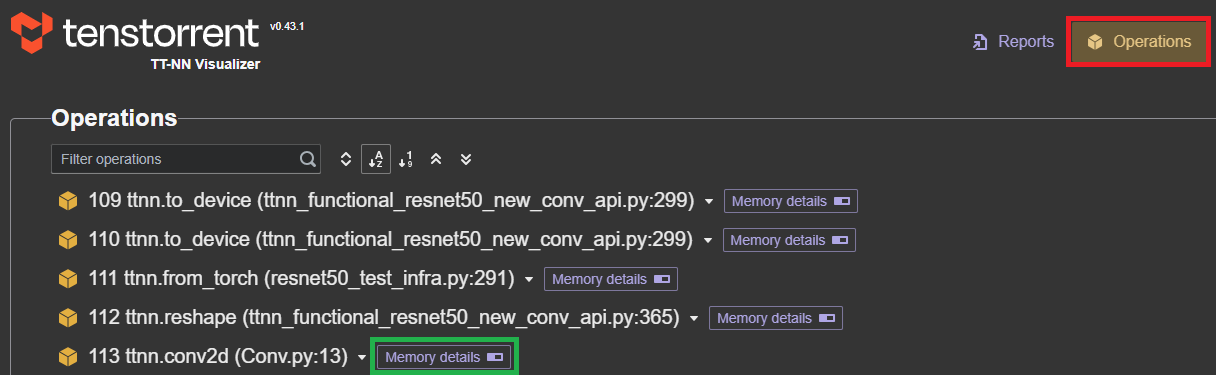
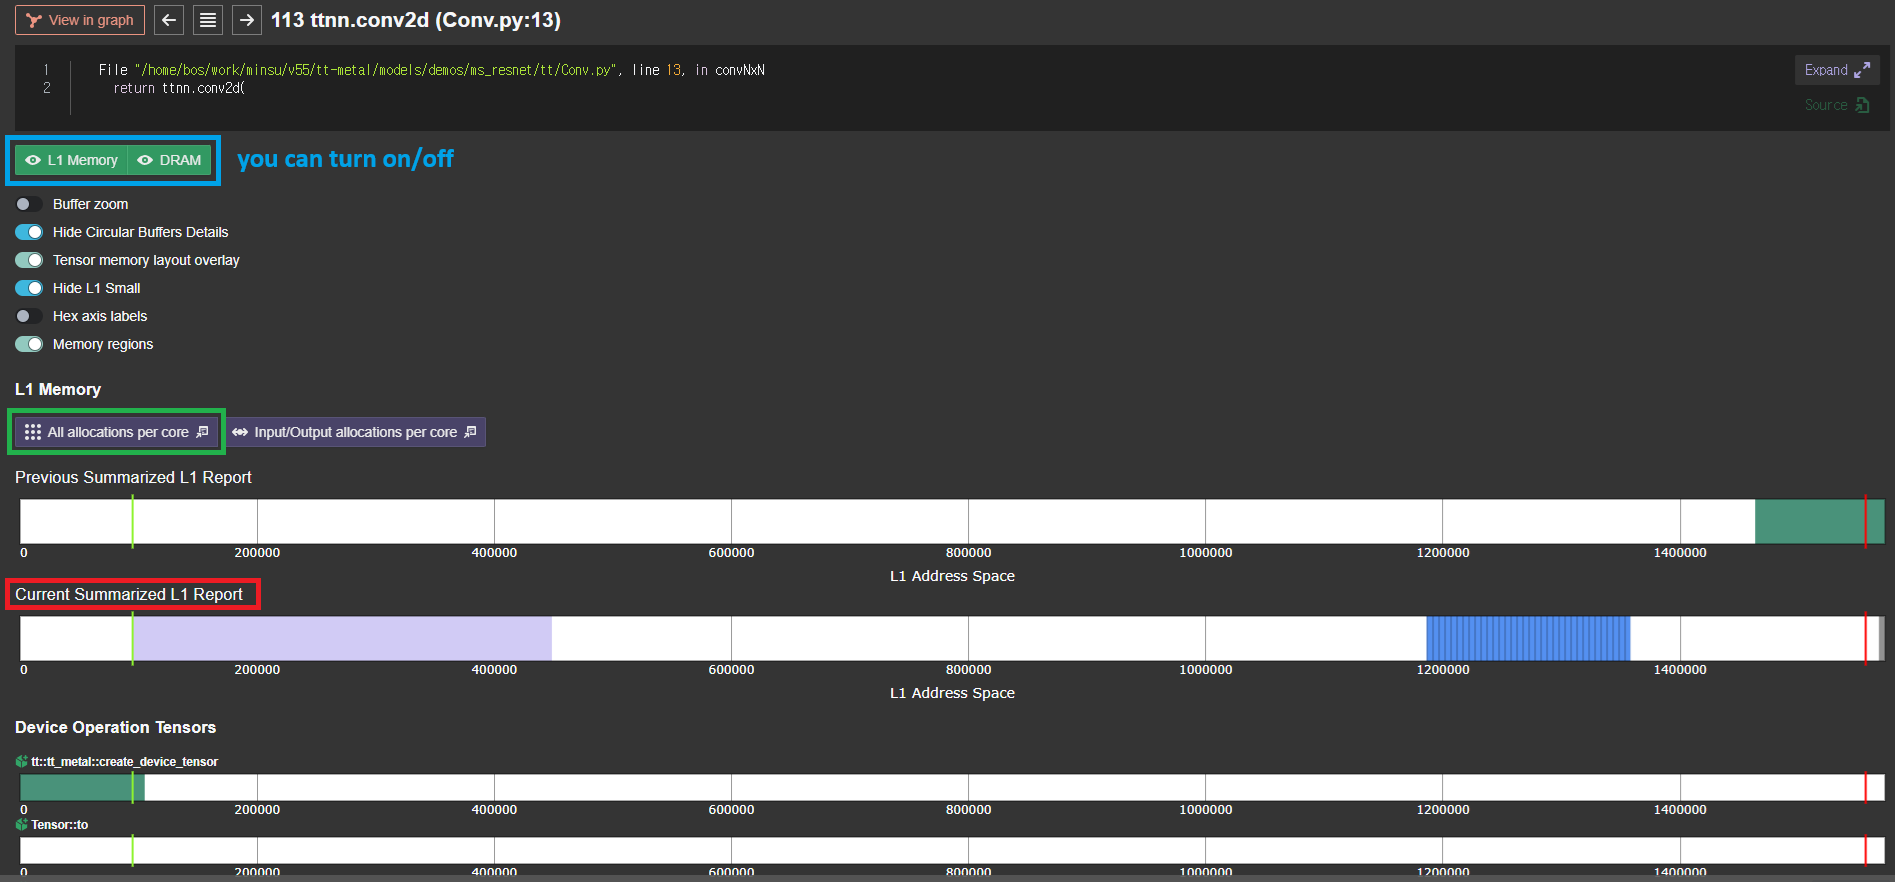
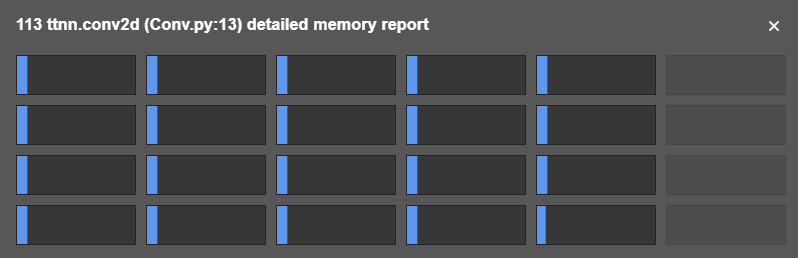
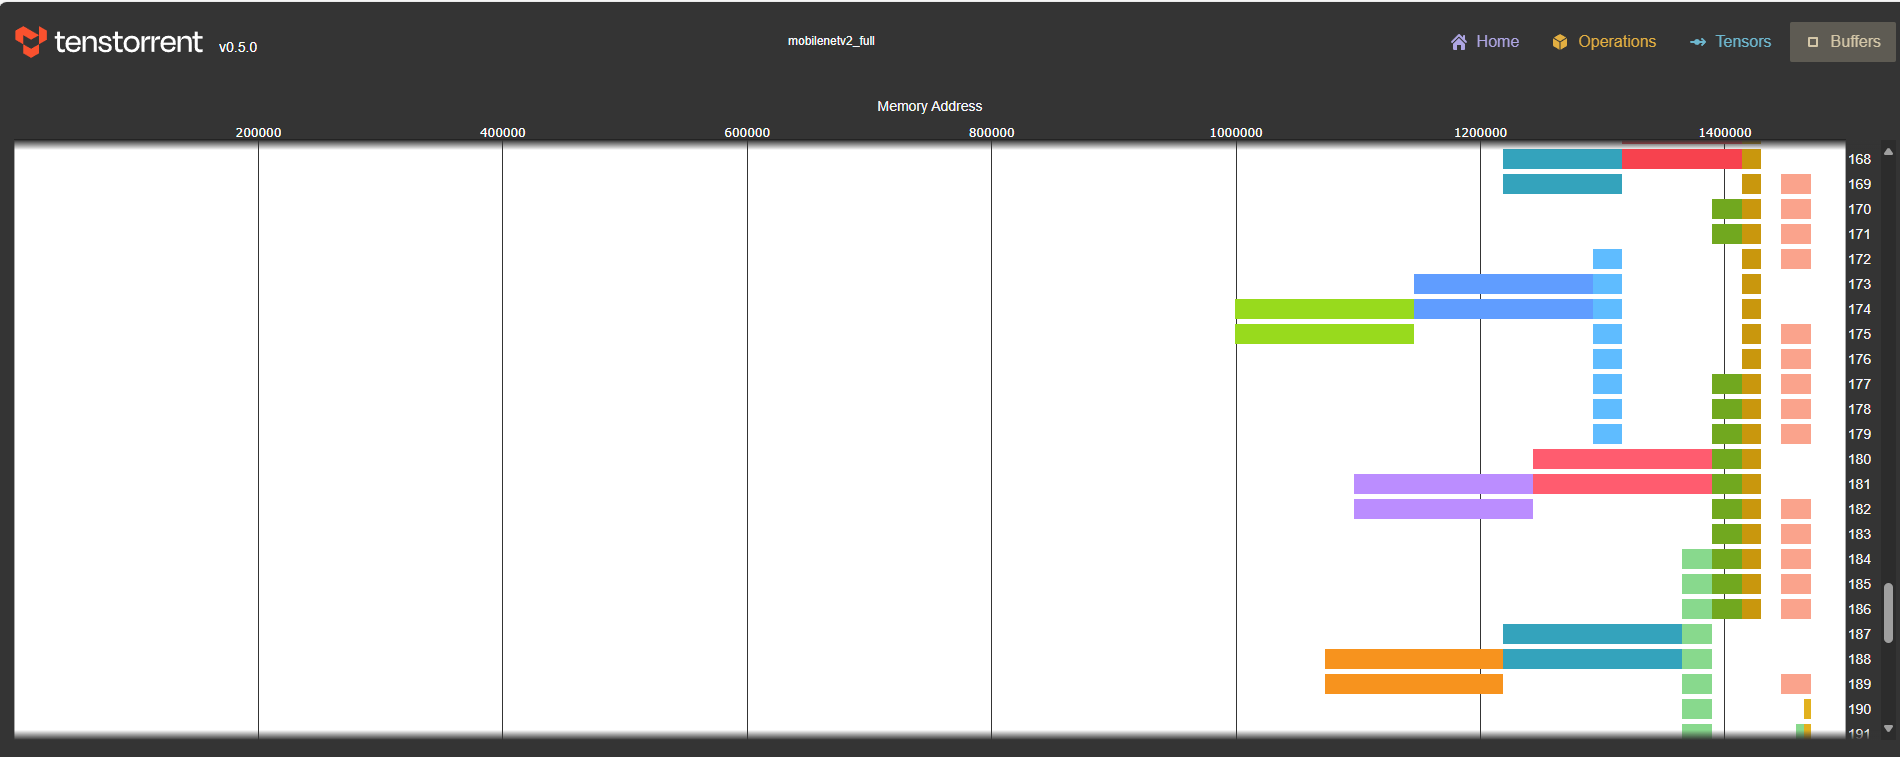
How to Use
In the menu at the top, you can observe the memory area through [Operations, Tensors, Buffers, Graphs], and you can usually check the L1 area for each operation by pressing [Memory details] after each Op in the [Operations] menu.