Performance Profiler
Performance profiler is built on top of Tracy which is an opens-source C++ profiling tool with sampling and code instrumentation profiling capabilities.
- Tracy is an open-source C++ profiling tool with both sampling and code instrumentation profiling capabilities.
- All host-side code, including Python code, in tt_metal can be profiled using Tracy.
- The profiling results for all cores’ RISCs can be viewed graphically.
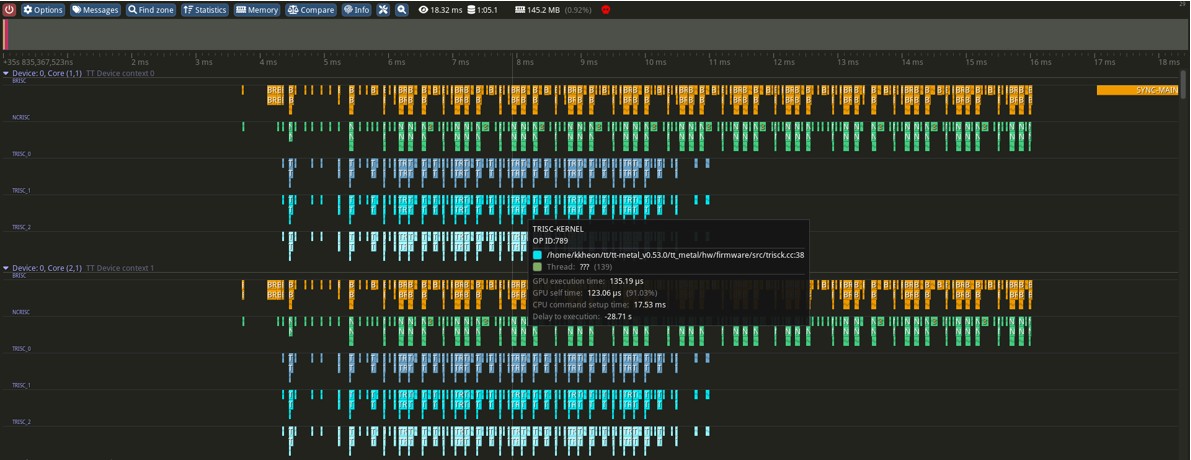
Figure 1. Screen capture of Tracy Profiling Tool
Tensix Core Architecture
Data Movement
- BRISC: Reads weights from DRAM → Circular Buffer (CB)
- NRISC: Reads activations from L1 → CB
Instruction Dispatch to Compute Engine
- TRISC0: For unpacker to read weight and activation data (CB → Src register)
- TRISC1: For compute to perform matrix multiplication (matmul)
- TRISC2: For packer to write results to CB (Dst register → CB)
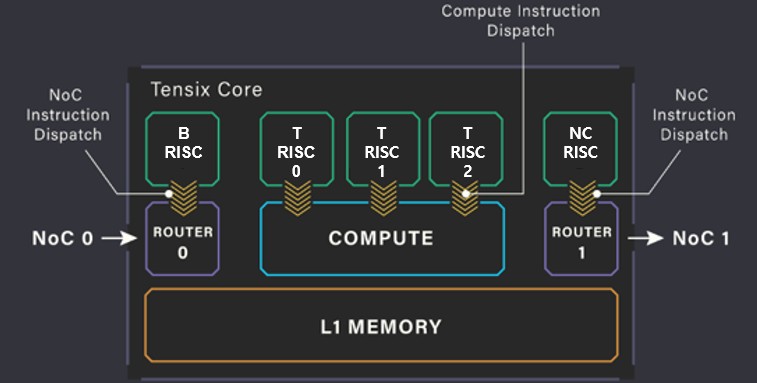
Figure 2. Tensix Core Architecture
Profiling with Tracy – (1) Source Code Edit
To profile the matmul operation, edit the following source file:
ttnn/cpp/ttnn/operations/matmul/device/kernels/compute/bmm_large_block_zm_fused_bias_activation.cpp
- Include the header and enable logging
#define DEBUG_TRACY_LOG 1
#if DEBUG_TRACY_LOG
#include "tools/profiler/kernel_profiler.hpp"
#endif - making a zone
void MAIN() {
    ...
    {
#if DEBUG_TRACY_LOG
        DeviceZoneScopedN("matmul_block");
#endif
        for (uint32_t inner_dim_idx = 0; inner_dim_idx < in0_block_w; ++inner_dim_idx) {
            matmul_block(
                in0_cb_id, in1_cb_id, in0_index, in1_index, dst_index,
                in1_transpose_tile, out_subblock_w, out_subblock_h, in0_block_w
            );
            in0_index++;
            in1_index += in1_block_w;
        }
    }
}
Profiling with tracy – (2) build and run
At the server
- 1. build with profiler option
$ cd tt-metal
$ build_metal.sh --enable-profiler - 2. build with profiler option
$ ENABLE_TRACY=1 TT_METAL_DEVICE_PROFILER=1 python -m tracy -r -p -v -m pytest models/demos/wormhole/vit/demo/demo_vit_ttnn_inference_perf_e2e_2cq_trace.py - 3. then tracy file is generated at ‘tt-metal/generated/profiler/.logs/tracy_profile_log_host.tracy'
- 4. download the tracy file to client
At the client
- 1. run tracy
- 2. ‘Open saved trace’ and open downloaded tracy file
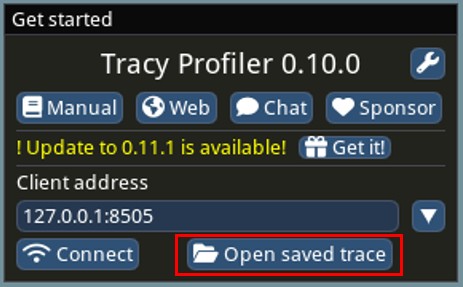
Figure 3. Tracy Control Box
Profiling with tracy – (3) matmul analysis
- TRISC0 waits until the activations and weights are loaded into the circular buffer
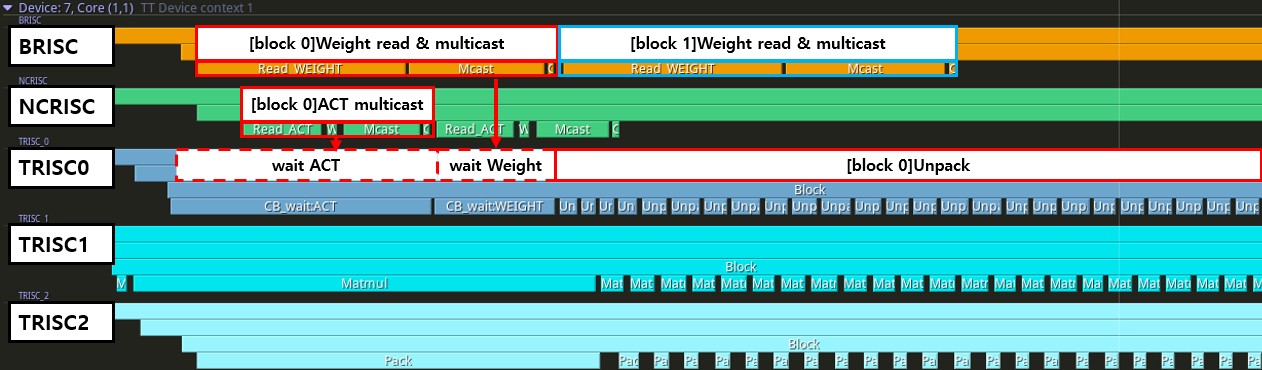
Figure 4. Analysis of MatMul Operation
Profiling with tracy – (4) matmul analysis
- TRISC1 waits until the unpacker fetches activations and weights into the source register
- TRISC2 waits until the math result is saved to the destination register
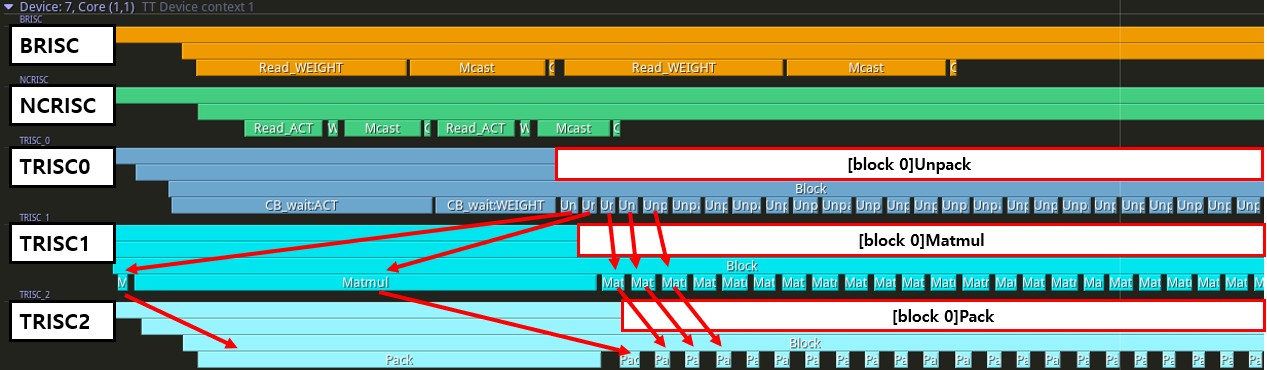
Figure 5. Analysis of MatMul Operation
Profiling with tracy – (5) Softmax analysis
- attention and softmax are fused
- 1. scale attention score → [multiply]
- load from scale value from DRAM, and multiply with attention score matrix
- 2. masking : mask + scaled attention score → [addition]
- TRISC0 waits until scale multiply is done and mask is loaded from NCRISC
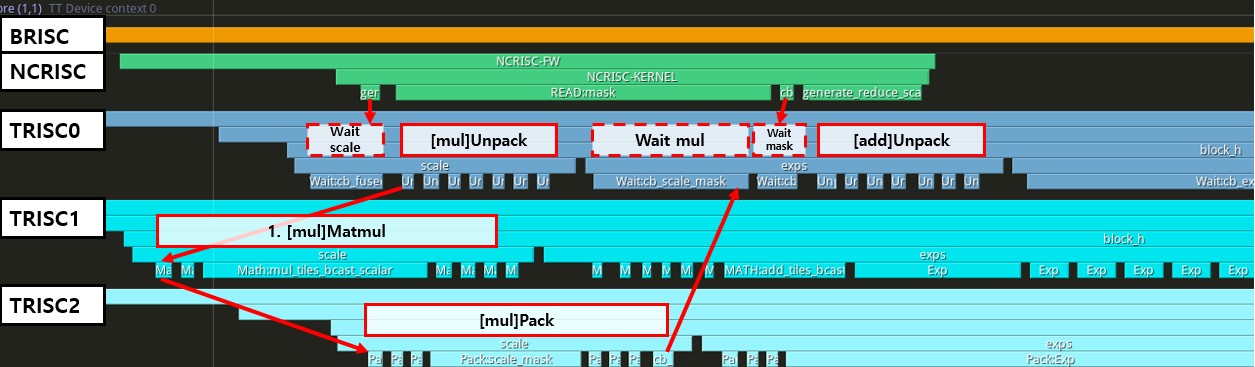
Figure 6. Analysis of Softmax Operation
Profiling with tracy – (6) Softmax analysis
- 2. masking : mask + scaled attention score → [addition]
- TRISC0 send instruction for unpacker
- TRISC1 send instruction for math to add, and result will be saved in dst register
- 3. exp(x) → [exponential]
- TRISC1 send instruction for exponential
- TRISC2 send instruction for packer, to save exponential result to CB
- TRISC0 wait until TRISC2 write the result to CB, then proceed to ‘sum’
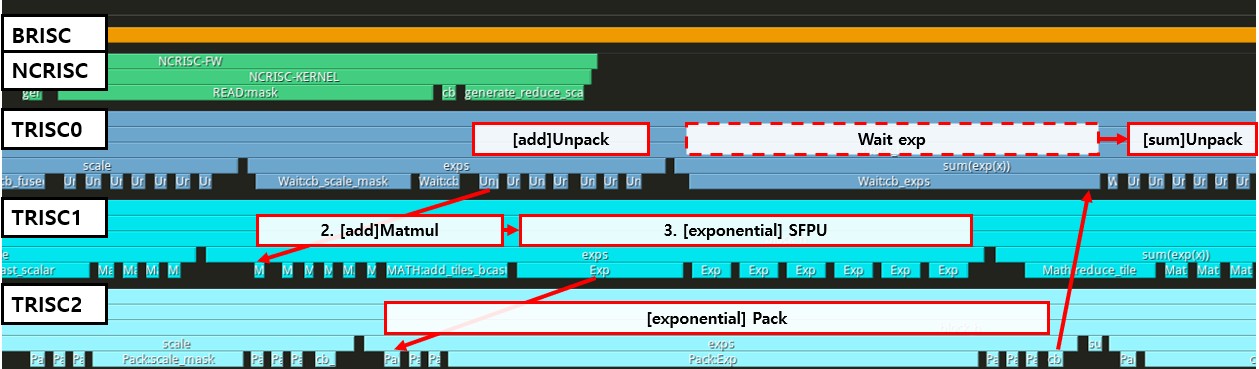
Figure 6. Analysis of Softmax Operation
Profiling with tracy – (7) Softmax analysis
- 4. sum(exp(x)) → [sum]
- unpack and matmul to sum the exponential results
- 5. 1/sum(exp(x)) → [recip]
- after matmul for sum, SFPUs calculate reciprocal of ‘sum(exp(x))
- 6. exp(x) / sum(exp(x)) → [mul]
- TRISC0 waits until packer save the ‘1/sum(exp(x))’, then multiply with exp(x)
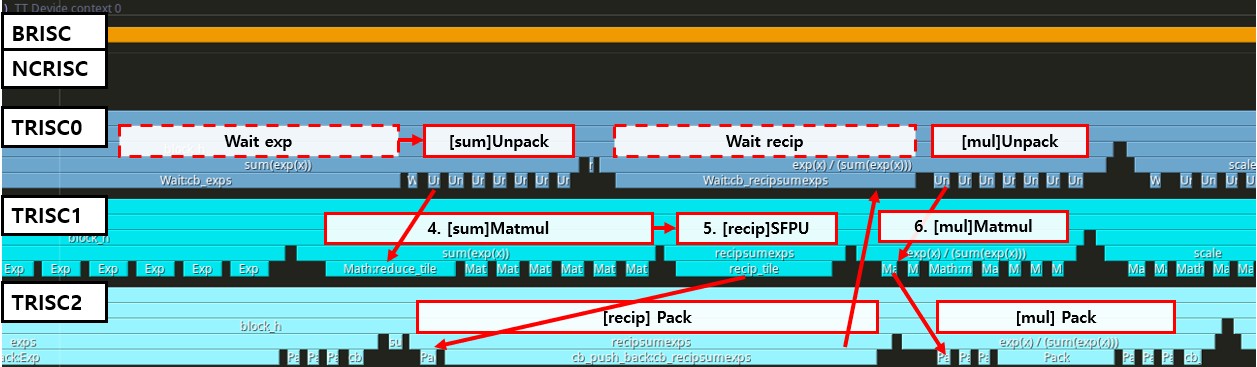
Figure 7. Analysis of Softmax Operation
Additional Resources
Tenstorrent Tracy Profiler How to Use
How to use DPRINT to see how the device works